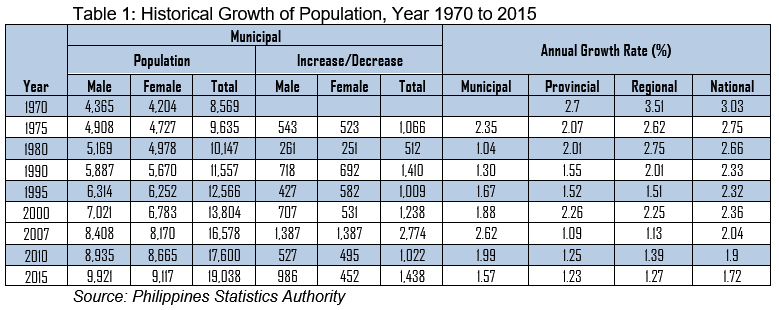
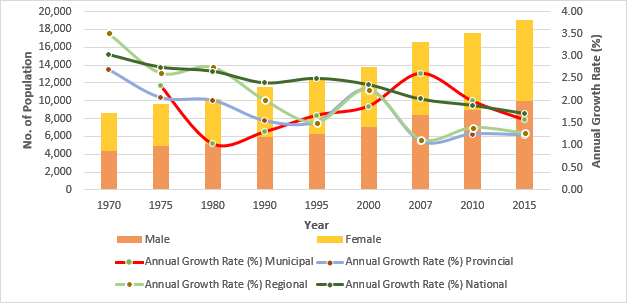
The table above shows the historical growth of the population of the municipality for 45 years (1970 to 2015). It shows an irregular pattern of positive growth rates. It was on years 1970 and 2007 where the annual growth rates had reached up to 2.35 and 2.62 respectively. The noted increase in annual growth rates is attributed to the geometric increase of population through birth and migration. These municipal annual growth rates for various census years manifest little changes as to the growth rates of the national, regional, and provincial levels as shown by the above table.
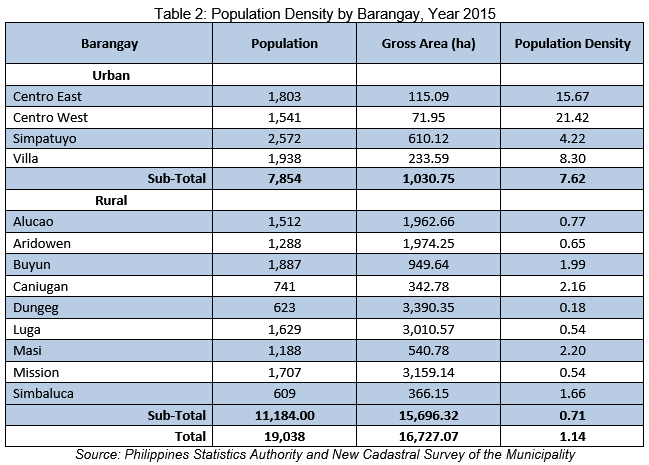
Based on the table above, the physical land area of 16,727.07 hectares and the 2015 population of 19,038, the municipality has a gross population density of 1.14 or one (1) person per hectare. This shows that the municipality still has a wide land area for its growing population to search and occupy. Among the barangays in the urban, Centro West is the densest with a gross population density of 21.42 or 22 persons per hectare and Simpatuyo is the least dense of 4.22 or four (4) to five (5) persons per hectare. On the other hand, the densest among the rural barangays is Masi with a gross population density of 2.20 or two (2) to three (3) persons per hectare and Dungeg is the least dense of 0.18 person per hectare. For the four (4) urban barangays, the urban population density is about 7.62 or eight (8) persons per hectare while, in the rural barangays, the rural population density is about 0.71 or one (1) person per hectare. This means there is more population count in every hectare of land area in the urban core.
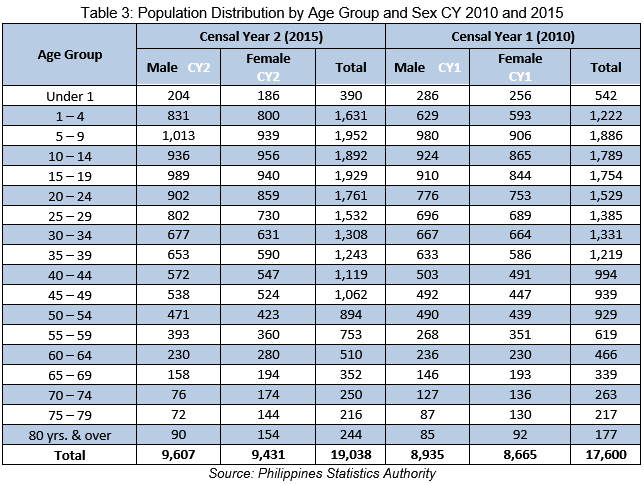
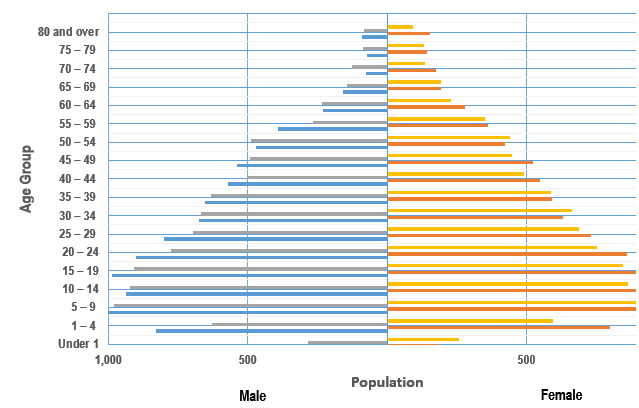
The table above shows the population distribution by age group and sex for the census years 2010 and 2015. Age group bracket of 5-9 manifests the highest number of the population both for census years 2010 and 2015 which constitutes 10.71 percent and 10.25 percent of the total population respectively. On the other hand, the age-group bracket of 85 and over manifests the least number of population for the census year 2010 of about 1.0 percent. While age group bracket of 75-79 manifests the least number of population for the census year 2015 of about 1.13 percent of the total population respectively.
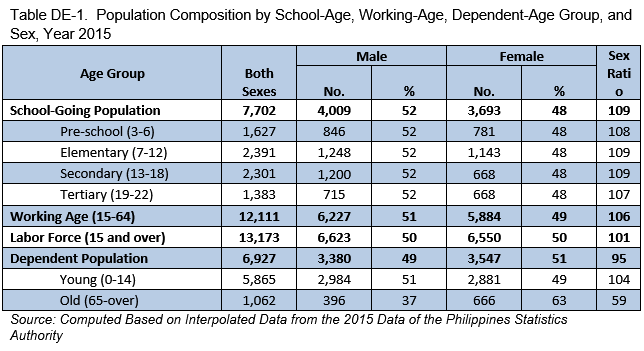
The table above shows the age grouping derived from the data collected by the Municipal Planning and Development Office. The municipality has a total of 7,702 school-going age population which constitutes 40.46 percent of the total population of 19,038 (PSA 2015). The implementation of the K+12 curriculum in the Philippine educational system made the mandatory inclusion of one (1) year kindergarten and an additional two (2) years in the secondary.
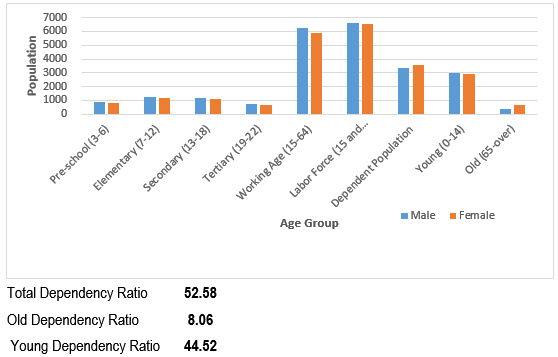
The working population of the working-age of 15-64 years old constitutes 63.61 percent of the total population with more males than females. Dependent population has a total of 6,927 which constitutes 36.39 percent of the total population. Of the 6,927 dependent population, 84.67 percent or 5,865 are young (0-14 years old) while, 15.33 percent or 1,062 are old (65 years old and over). The labor force has a total population of 13,173. It means that for every one(1) economically active person, it supports two dependent persons or 52.58 or 53 persons per 100 productive populations.
As computed, the dependency ratio is 52.58. With this, a deeper analysis must be undertaken to determine whether the persons in the labor force are gainfully employed or not. Generation of job opportunities that match the skills, capabilities, and educational qualifications of the labor force should be given importance to maximize their potentials and contributions to the socio-economic development of the municipality. Male is dominant over a female with an average sex ratio of 103.
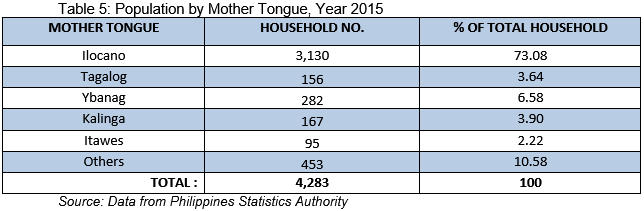
The table above shows the population by mother tongue for CY 2015. Ilocano dominates the other mother tongue with 73.08 percent, followed by other dialects of 10.58 percent, Ybanag of 6.58 percent, Kalinga of 3.90 percent, Tagalog of 3.64 percent, and Itawes of 2.22 percent respectively.
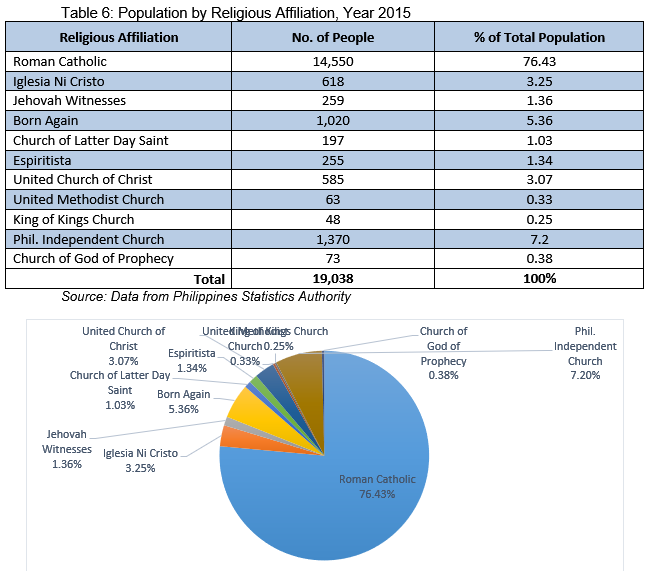
The table above shows the population by religious affiliation for CY 2015. Roman Catholic dominates the other religions with 76.43 percent. However, other religious affiliation contributes about 23.57 percent making King of Kings Church having the least with 0.25 percent.